
Welcome to the
Underdog Trade Club!
Flip the script on traditional trading. Join us and become part of a revolutionary trading movement led by the techniques of Bernd Skorupinski.Elevate your trading game with the Underdog Trade Club. Gain exclusive access to proven strategies and tools used by Bernd Skorupinski, real-time signals, and a supportive community of like-minded traders.


DISCLAIMER:
The Underdog Trade Club is an independent trading community inspired solely by publicly available strategies, methods, tools, and ideas of Bernd Skorupinski. We are not affiliated with, endorsed by, sponsored by, or officially connected to Bernd Skorupinski or his official brands. References to Bernd Skorupinski or his techniques are strictly for informational and educational purposes and do not constitute an endorsement, sponsorship, or partnership.
About Our Rebellion
We've dedicated extensive resources to replicating Bernd Skorupinski success and indicators used by him. These tools are crafted to give you a unique advantage in the market—just like Bernd's methods that consistently outperform.Here's How You Benefit- Leverage Our Indicators: Our indicators are meticulously crafted to replicate the precision of those used by Bernd Skorupinski.- Community Collaboration: Join a club of like-minded traders sharing insights, trades, and strategies. Success is a team effort here.- Weekly Signals: Get exclusive access to Weekly Signals to help you stay ahead in the market.

Fuel The Revolution
With Our Exclusive Membership
Join the ranks of passionate traders ready to dominate the market.
Limited Offer
Join an exclusive club of traders dedicated to learning and mastering the techniques inspired by Bernd Skorupinski—access real-time market insights, exclusive tools, and a collaborative space to elevate your trading journey.
$150 $500/Year
Hurry! Limited-Time Offer - Save $350 Today!
Weekly Market Publications
The Club
Extensive Trading Knowledge
The Database
Proprietary Indicators
 Pay with Card
  Pay with Crypto
What We Offer

Collaborative Chaos
Join a band of traders who share trades, signals, and market analysis. This is where we thrive together.

Bernd Skorupinski Indicators
Gain access to indicators that replicate Bernd’s successful trading tools. These indicators include The COT Net Position, AI Seasonality Tool, COT Smart Money Index Tool, and the Campus Valuation Tool.

Course and Weekly Signals
Get exclusive access to weekly signals designed to keep you ahead in the market, along with a comprehensive course where you'll learn our strategy firsthand.
All Indicators:
Bernd Skorupinski Indicators Explained
Bernd Skorupinski Course – Online Trading Campus AI-hybrid System
Bernd Skorupinski provides valuable strategies and techniques used by underdog traders.
KEY FEATURES OF THE COURSE
Student Orientation
Blueprint
Strategy 101
Supply and Demand
Fundamentals for Market Setups
Market Timing
Strategy Optimization
Futures
Forex
Stock Investor
Price Action
The Pro Investor Business Plan
Mastering the Mental Game
Funded Trader Weekly Outlooks

What Underdogs Are Saying
Frequently Asked Questions
DISCLAIMER:
The Underdog Trade Club is an independent trading community inspired solely by publicly available strategies, methods, tools, and ideas of Bernd Skorupinski. We are not affiliated with, endorsed by, sponsored by, or officially connected to Bernd Skorupinski or his official brands. References to Bernd Skorupinski or his techniques are strictly for informational and educational purposes and do not constitute an endorsement, sponsorship, or partnership.
The Underdog Trade Club is here to help you reach your goals! 🎯
First, you learn, then you earn. Join us and unlock your trading potential!
Commitment of Trader

There are 4 Commitment of Traders (COT) Indicators included:
COT Index
COT Commercial Net Position
COT Non-Commercial Net Position
COT Non-Reportable Net Position
OVERVIEWThe Commitment of Traders (COT) Indicator is a trading tool designed to display the net positions of traders, reported weekly by the regulatory commissions. It helps visualize the overall market sentiment using a clear chart format.
CONCEPTSThis indicator shows whether traders are holding long or short positions compared to their historical data. Tracking these changes helps you analyze potential medium- to long-term market trends with greater accuracy.Commercial traders are typically producers or consumers who use the market to hedge against price fluctuations and protect their assets.
Non-commercial traders are usually funds or professional managers focused on speculating for profit.
Non-reportable traders represent small retail participants in the market.By understanding how these groups interact, you gain deeper insights into market dynamics, making it easier to forecast potential price movements.
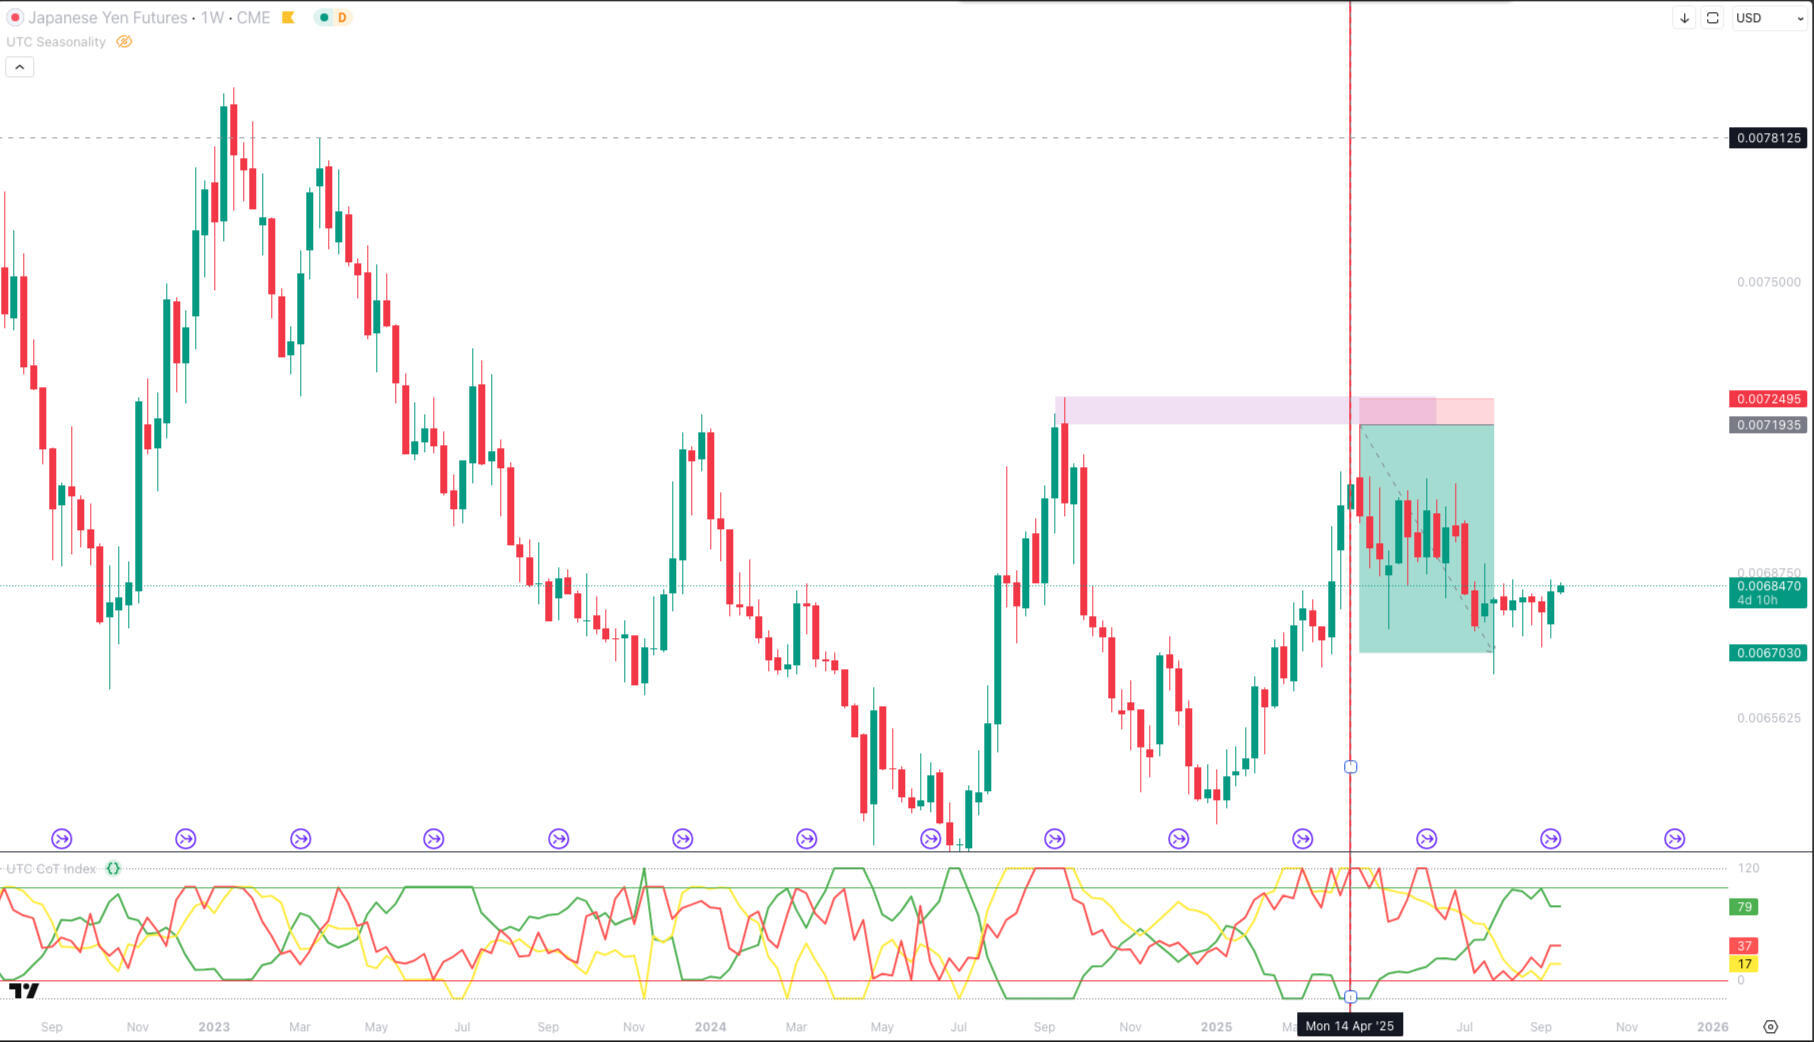
DETAILS & EXAMPLE OF HOW TO USEAn example of the Japanese Yen Futures Chart (6J1!) to demonstrate the indicator in real market scenario.

The green line represents the Commercial Index, currently sitting at an extreme low of -20. Commercial traders are considered the smart money, so their positioning often signals major market moves. At this level, they are heavily short, suggesting that a potential shift toward a downward trend could be coming soon.

At the same time, the yellow line represents the Non-Commercial Index, which is currently at an extreme high of 120. Non-commercial traders are typically trend followers, staying with the prevailing move until they reach an extreme position. When this happens, it often signals that a reversal may be near. In this case, the non-commercials are at a strong buy extreme, indicating a potential shift to the downside.By combining this insight with other technical strategies on the same or lower timeframes, such as identifying key Supply and Demand zones, traders can refine their entry points for a higher probability setup.

The result is a massive push to the downside in the long term direction.
FEATURES
Customisable historical period and threshold
Further look back periods
All COT Net positions in one
NOTES
This indicator works best when applied to a weekly futures chart, as COT data is only released once per week.
For more precise trade entries, it should be combined with lower-timeframe technical tools, such as Supply and Demand zones.
Valuation Tool

OVERVIEWThe Valuation Indicator is a trading tool designed to measure the relative value of one asset compared to another. It helps traders determine whether an asset is overvalued or undervalued, providing insights that can guide better trading decisions.
CONCEPTSThe Valuation Indicator calculates the relative value between selected assets by measuring their price deviation. For instance, it can be used to compare the Japanese Yen with the Dollar Index or Treasury Bonds. Its primary purpose is to identify overbought and oversold conditions, helping traders spot potential reversal points.Typically, equities and indices are compared against Treasury Bonds and the Dollar Index, while assets like major FX pairs, precious metals, and energy commodities are compared to the Dollar Index.
The indicator includes adjustable settings such as threshold, timeframe, and smoothing values, allowing traders to filter out market noise and enhance signal accuracy.
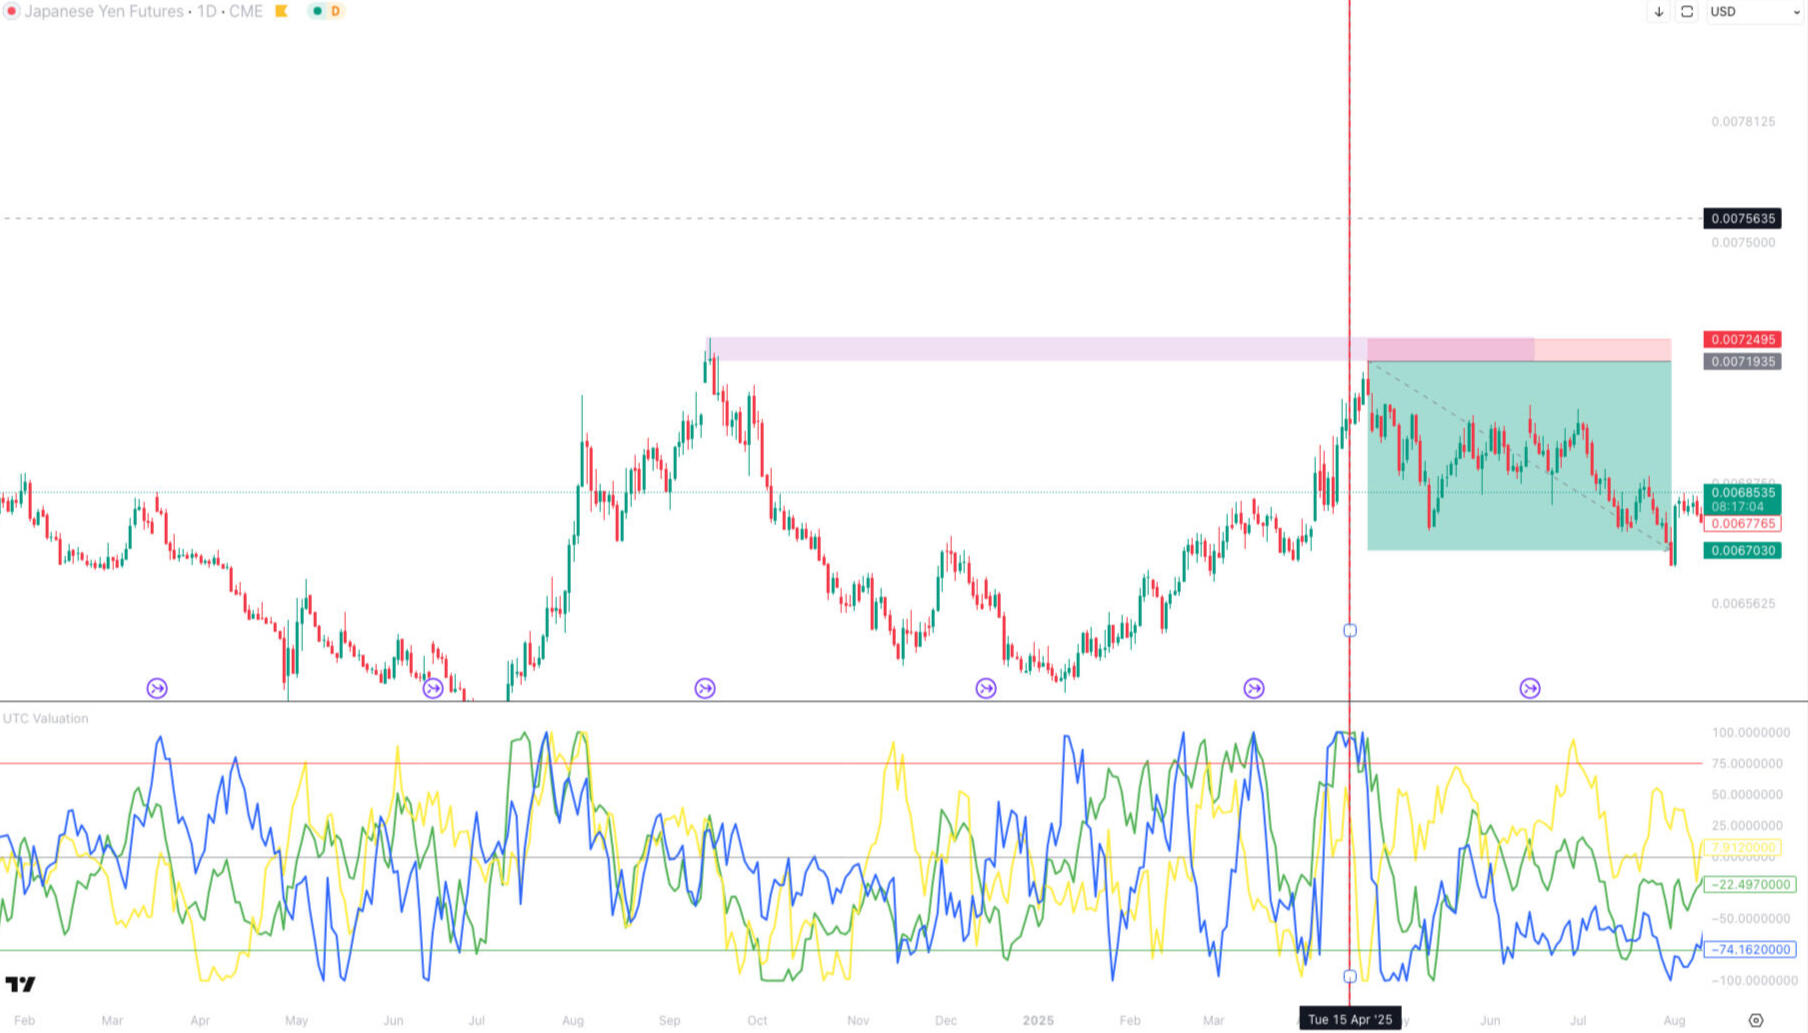
DETAILS & EXAMPLE OF HOW TO USEAn example of Japanese Yen chart to demonstrate the indicator in real market scenario.

Green graph indicate the Dollar Index (DXY) Index, showing overvalued reading above 75

At the same time, the blue line represents the Treasury Bond Index, which is currently showing an overvalued level above 75. This suggests that Japanese Yen is trading at a relatively expensive level compared to the Treasury Bonds.By combining this information with other technical strategies on the same or lower timeframes, such as identifying Supply and Demand zones, traders can pinpoint high-probability entry points and strengthen their overall trading strategy.
The result is a massive push to the upside hitting more than 1:5.

FEATURES
3 Flexible symbols for comparison in 1 indicator.
Individually show or hide any symbol.
Adjustable smoothing value, lower & upper threshold.
NOTES
Should be combined with other lower-timeframe technical tools like supply and demand.
The Indicator is best applied on the daily chart.
True Seasonality

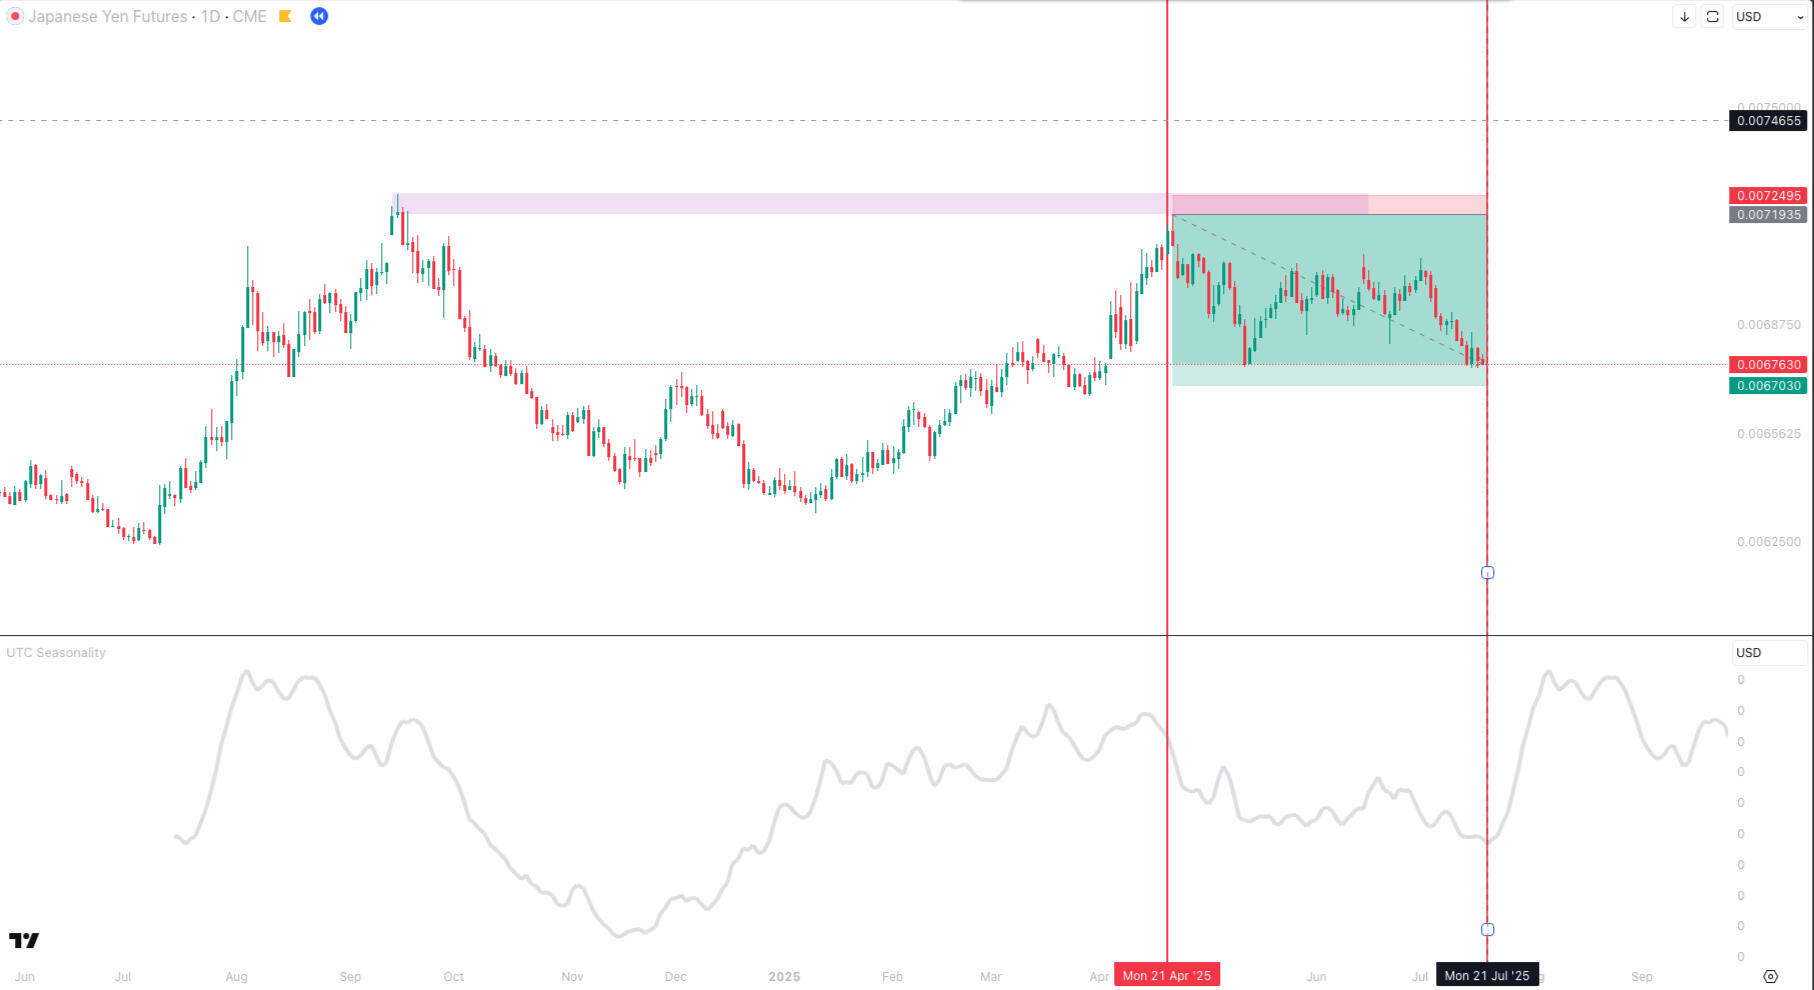
CONCEPTSThe True Seasonality Indicator is designed to forecast price movements by analyzing historical market data. It helps traders identify recurring patterns and seasonal trends that tend to repeat over time. This indicator is most effective when applied to a daily chart, providing valuable insights for anticipating potential market moves and planning trades accordingly.
DETAILS & EXAMPLE OF HOW TO USE

On the Japanese Yen chart, the indicator’s projection shows a seasonal downtrend expected to begin around April 21, 2025, and continue until July 21, 2025. This forecast provides a clear outlook of what to anticipate in the coming months.By combining this seasonal insight with Supply and Demand analysis, traders can better time their entries and exits. The result is a well-structured trading setup that aligns perfectly with the predicted downtrend highlighted by Bernd Skorupinski’s indicator.

FEATURES
Adjustable look-back period
Adjustable forecast length
NOTES
The Indicator is best applied on daily chart.
Should be combined with other technical tools like supply and demand to find entry and confirmation.
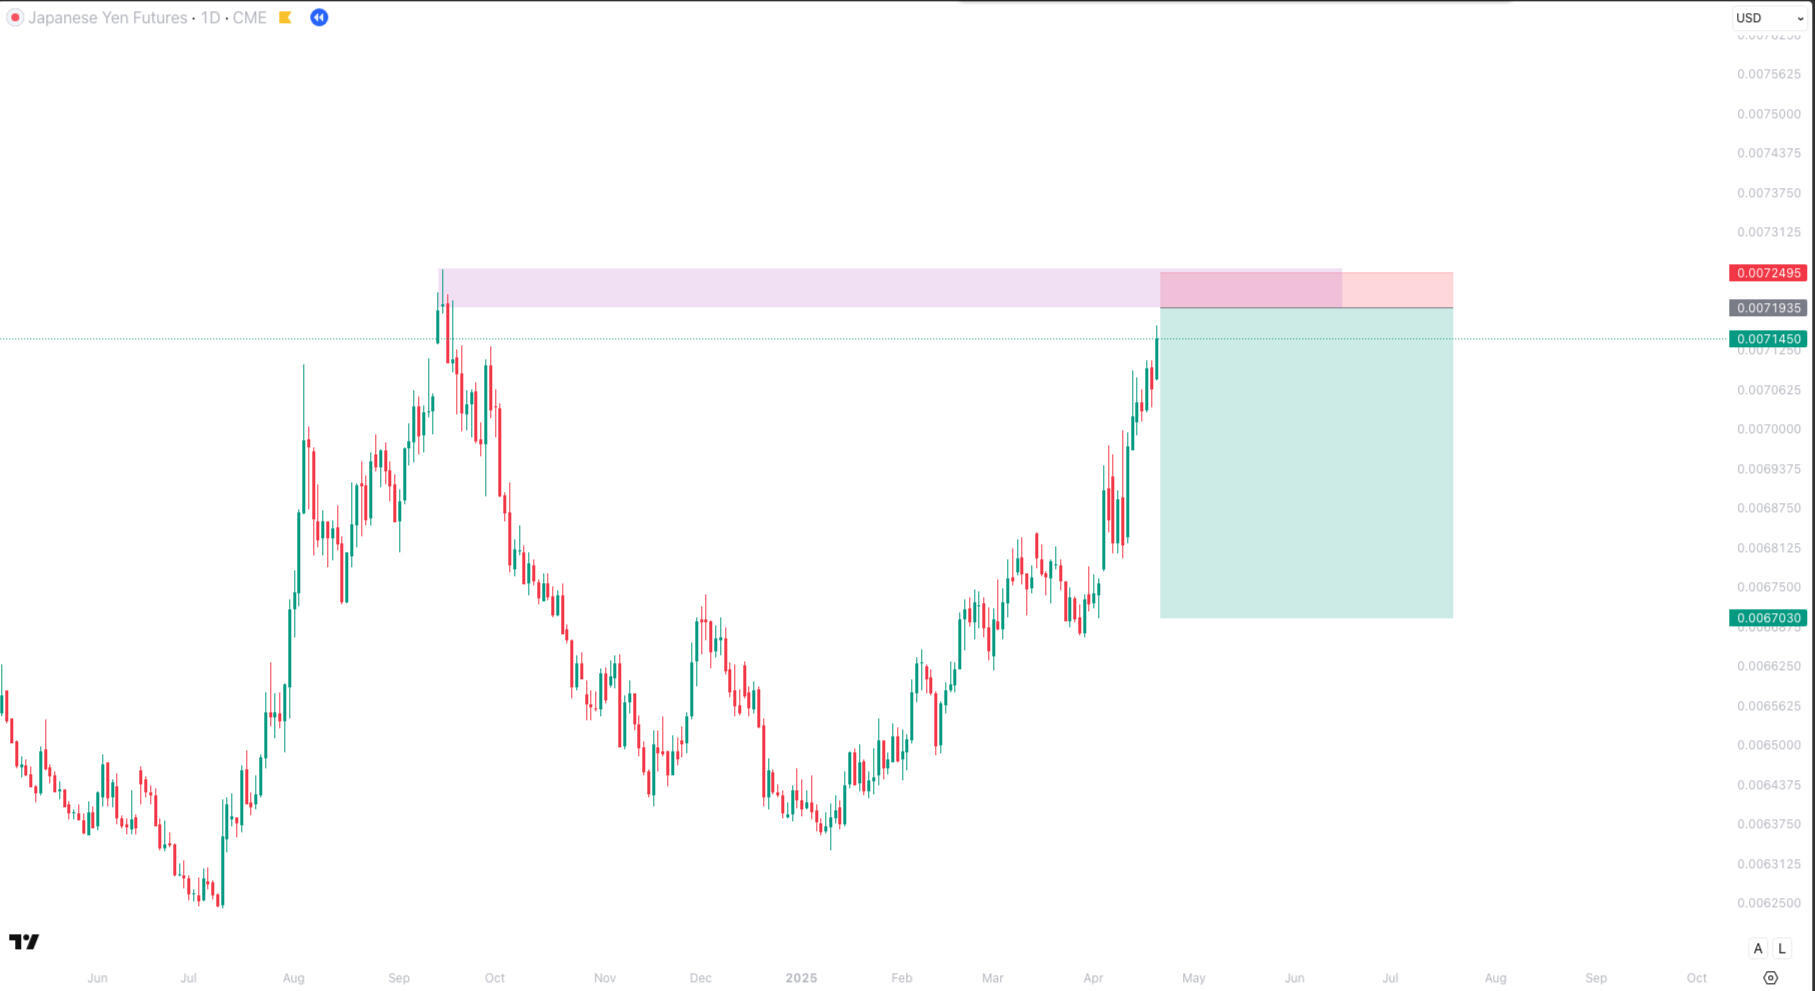
Supply and Demand

CONCEPTSSupply and Demand reflects the activity of institutional traders within price action. These zones act like magnets, highlighting areas where large limit orders remain unfilled due to rapid price movement, which creates a temporary lack of buyers or sellers in that region.These zones are identified by specific patterns, such as Rally-Base-Rally, Rally-Base-Drop, Drop-Base-Drop, and Drop-Base-Rally. The base is characterized by candles with smaller bodies compared to the surrounding candles, indicating a brief pause before a strong move.
DETAILS & EXAMPLE OF HOW TO USE

NOTES
The Indicator should be used along side with High Timeframe Analysis using Bernd Skorupinski indicators.
There are a lot of criteria to determine which candle to pick as a good Supply & Demand, (like the location, originality, freshness, etc) which is explained more detail in the learning course.