Higher timeframe trading: fewer, better trades
Higher timeframe (HTF) trading means taking your direction and your levels from the weekly and daily charts, and holding trades for days to weeks. It suits people with jobs, prop-firm accounts that punish overtrading, and anyone tired of watching one-minute candles.
Why the higher timeframes
- Less noise. A weekly zone took more orders to build than a five-minute one, and the big players who move a market plan on these charts.
- Fundamentals line up. COT positioning, valuation and seasonality are weekly or slower. They agree with weekly charts far better than with intraday swings.
- Time. You can plan a week's trades in an hour on the weekend and check them once a day.
Top-down, in four steps
- Bias from fundamentals: COT, valuation and seasonality on the weekly chart.
- Location: is price near a weekly or monthly supply or demand zone?
- Nested zones: a daily zone that sits inside a weekly zone ("big-brother backing") is a higher-quality level than one on its own.
- Plan: entry, stop beyond the zone, target at the next opposing zone, and a minimum reward to risk before you place it.
What we found when we tested it
We are honest about results. When we tested intraday versions of these ideas, none held up after costs and out-of-sample checks. The edges we track live are on daily and weekly data, graded on the members' track record, and several club rules are labelled forward-test only until the live record proves them.
Start here
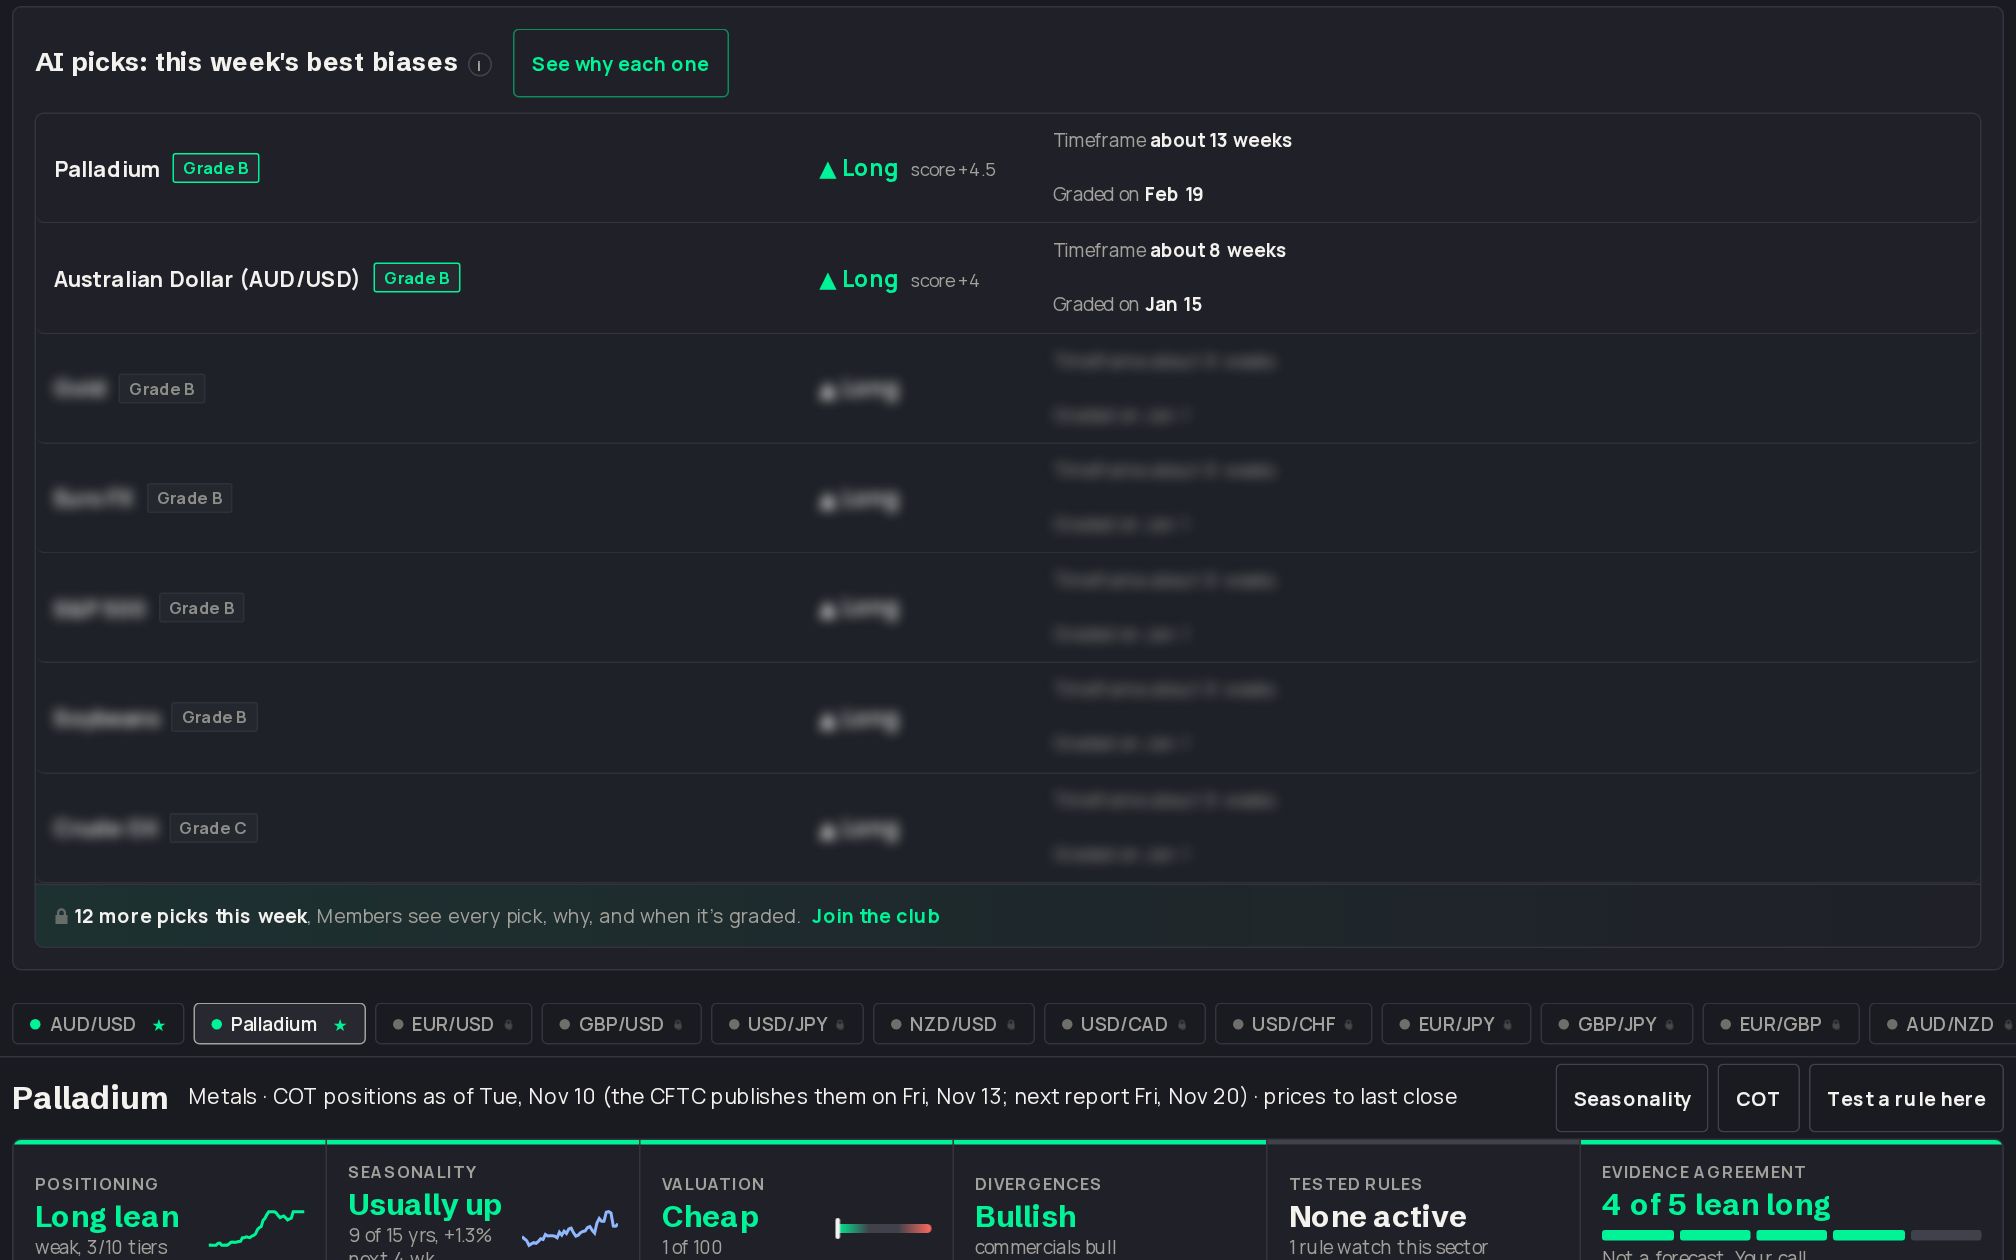
Read the two-step strategy, then open the dashboard to see the bias for every market this week. In the club, members post their higher-timeframe trades before they trigger, and every result is tracked in R.
The Underdog Trade Club is an independent community and is not affiliated with Bernd Skorupinski, Larry Williams, Seasonax or their official brands.
Questions
What is the best timeframe for swing trading?
Most swing traders take direction from the weekly chart and plan entries on the daily. Lower timeframes are only for fine-tuning an entry inside a higher-timeframe level.
How long are higher timeframe trades held?
Usually days to a few weeks, depending on the distance to the next opposing zone.
Is higher timeframe trading good for prop firms?
It can be, because it means fewer trades and wider, planned stops. Size each trade so one stop can't break the daily loss limit.
Do I need to watch the charts all day?
No. Plan on the weekend, set alerts at your zones, and check once or twice a day.