A free Seasonax alternative for futures and forex traders
Seasonax is a well-built seasonality platform, and many traders first meet seasonal charts there. If you mainly trade forex, metals, energy, grains, softs, meats, index futures and crypto on daily and weekly charts, our free seasonality explorer covers the parts of seasonal analysis those traders use most, and ties them to positioning and zones.
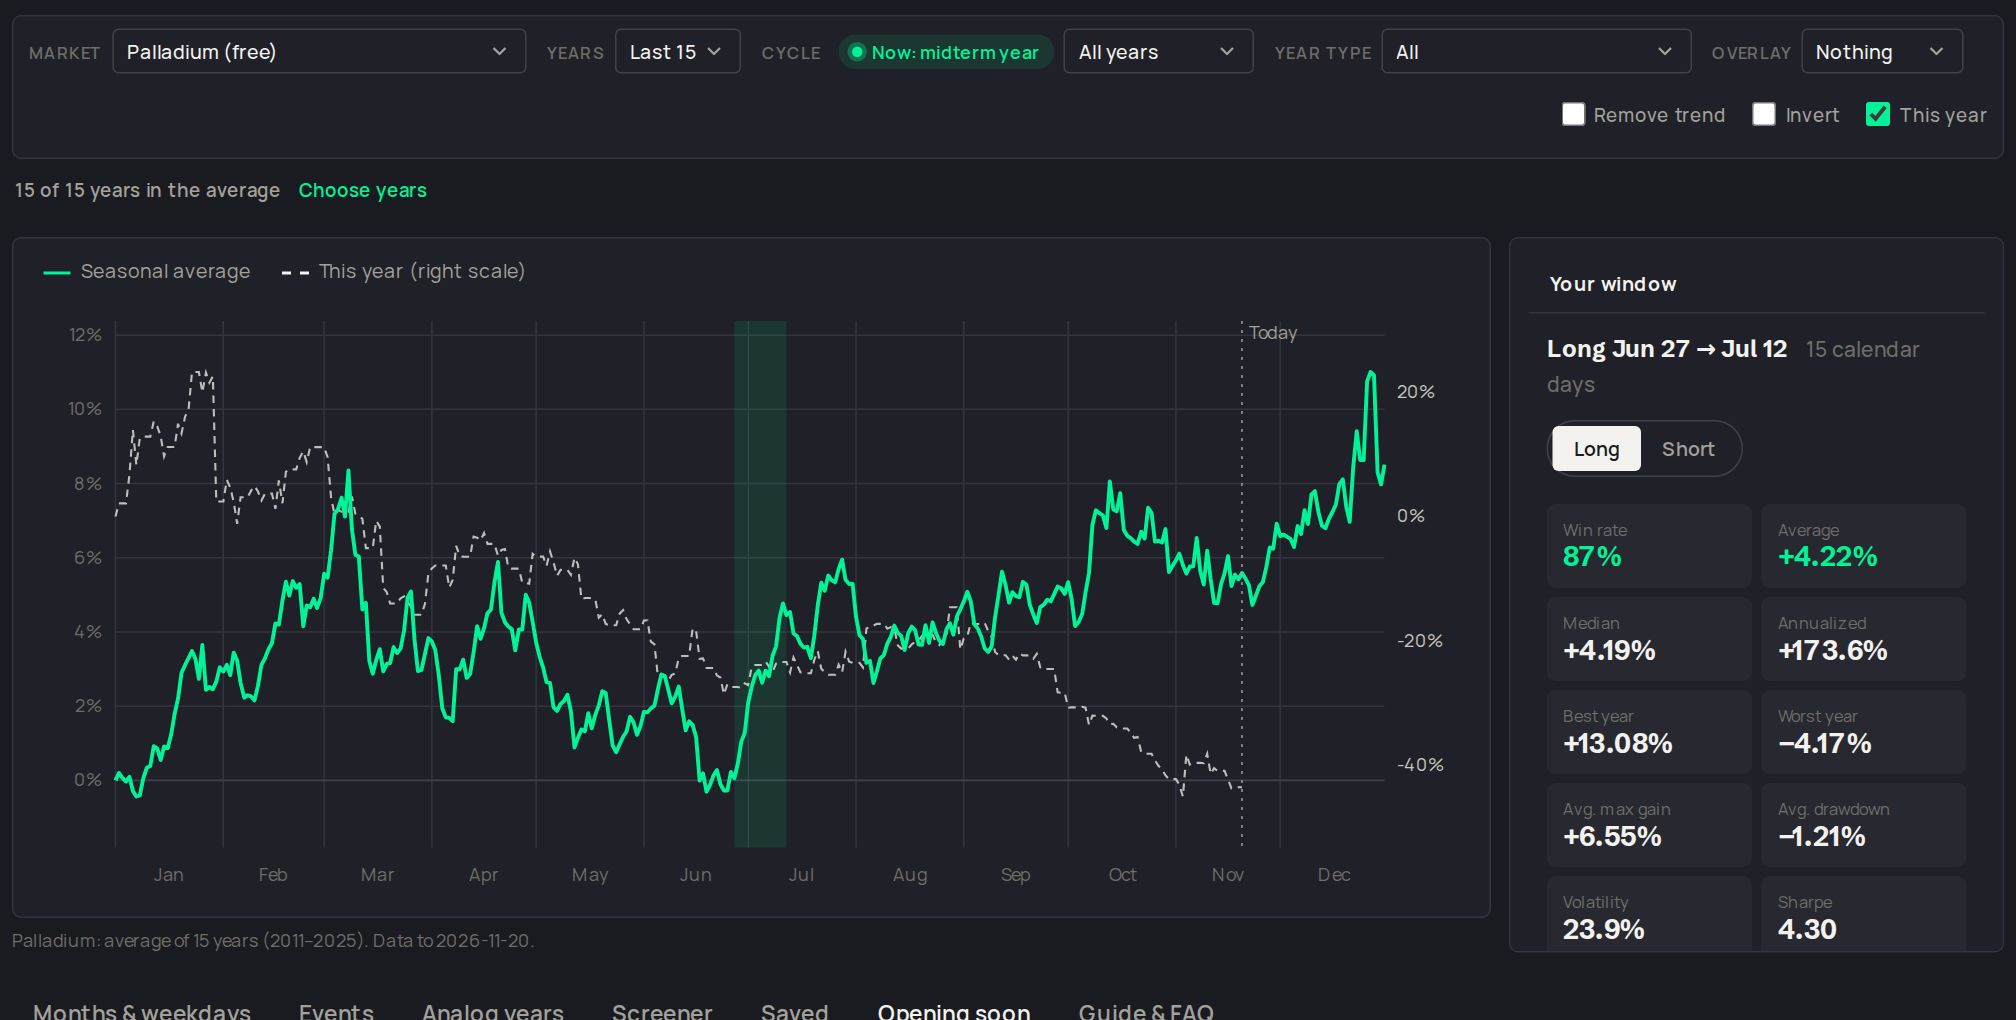
What you get for free
- Seasonal charts for 50+ markets, averaged over the last 5, 10, 15, 20, 25 or 30 years, with this year drawn on top.
- Any window, tested. Drag across the chart to test a date window: win rate, average and median move, best and worst year, average drawdown, and every year's result in a table.
- The neighbour test. We show the win rate if you start a few days earlier or later, so you can see whether a window is robust or a lucky date.
- Presidential-cycle and year-type filters: election, post-election, midterm and pre-election years, bull or bear years, and the years whose path looks most like this one.
- Event studies: how a market moved in the days around Fed and ECB rate hikes and cuts, US elections, the turn of the month and quarter, and the main US holidays.
- A screener of the strongest windows opening in the next two weeks across every market, ranked by how often they paid.
- Months and weekdays: the average return by month and by day of the week.
Where Seasonax goes further
Being fair: Seasonax covers thousands of single stocks and many more indices, has an intramonth view, baskets, alerts and uploads of your own data. If you trade single stocks by seasonality, it is built for that. We focus on the futures and forex markets swing traders use, and put seasonality next to the other evidence.
Open the seasonality explorerDrag across any window and see how often it paid, year by year, and whether it beats chance.Seasonality is one input, not a signal
A window that paid 13 of the last 15 years is a tailwind, not a trade. In our club, seasonality is one of three bias inputs, with COT positioning and valuation, and entries come from supply and demand zones on the higher timeframes. The dashboard puts all of it on one screen for every market, and every AI pick is graded on the members' track record.
How to use it in two minutes
Open the seasonality explorer, pick a market and 15 years, then tap one of the strongest patterns. Check the neighbour test and the worst year. If the window still looks good, look at the COT and valuation for the same market before you even think about an entry.
The Underdog Trade Club is an independent community and is not affiliated with Bernd Skorupinski, Larry Williams, Seasonax or their official brands.
Questions
Is there a free alternative to Seasonax?
Yes. The Underdog Trade Club's seasonality explorer is free to use for core markets, with seasonal charts, win rates for any window, presidential-cycle filters, event studies and a screener. Members get every market.
Does it cover stocks like Seasonax?
No. It covers futures, forex, index futures and crypto: the markets swing traders use with COT data. For single-stock seasonality, Seasonax is the better fit.
How many years of data does it use?
You choose: the last 5 to 30 years, or all available history, and you can include or drop individual year types.
Is a high seasonal win rate enough to take a trade?
No. Treat it as a tailwind. Check the neighbour test, the worst year, and whether positioning and valuation agree before planning an entry.