The Larry Williams COT index and valuation indicator, explained
Larry Williams popularised two simple ideas that many swing traders still use for their weekly bias: follow what the commercials are doing in the Commitments of Traders report, and ask whether a market is cheap or expensive against other markets. Bernd Skorupinski builds the first step of his method on both.
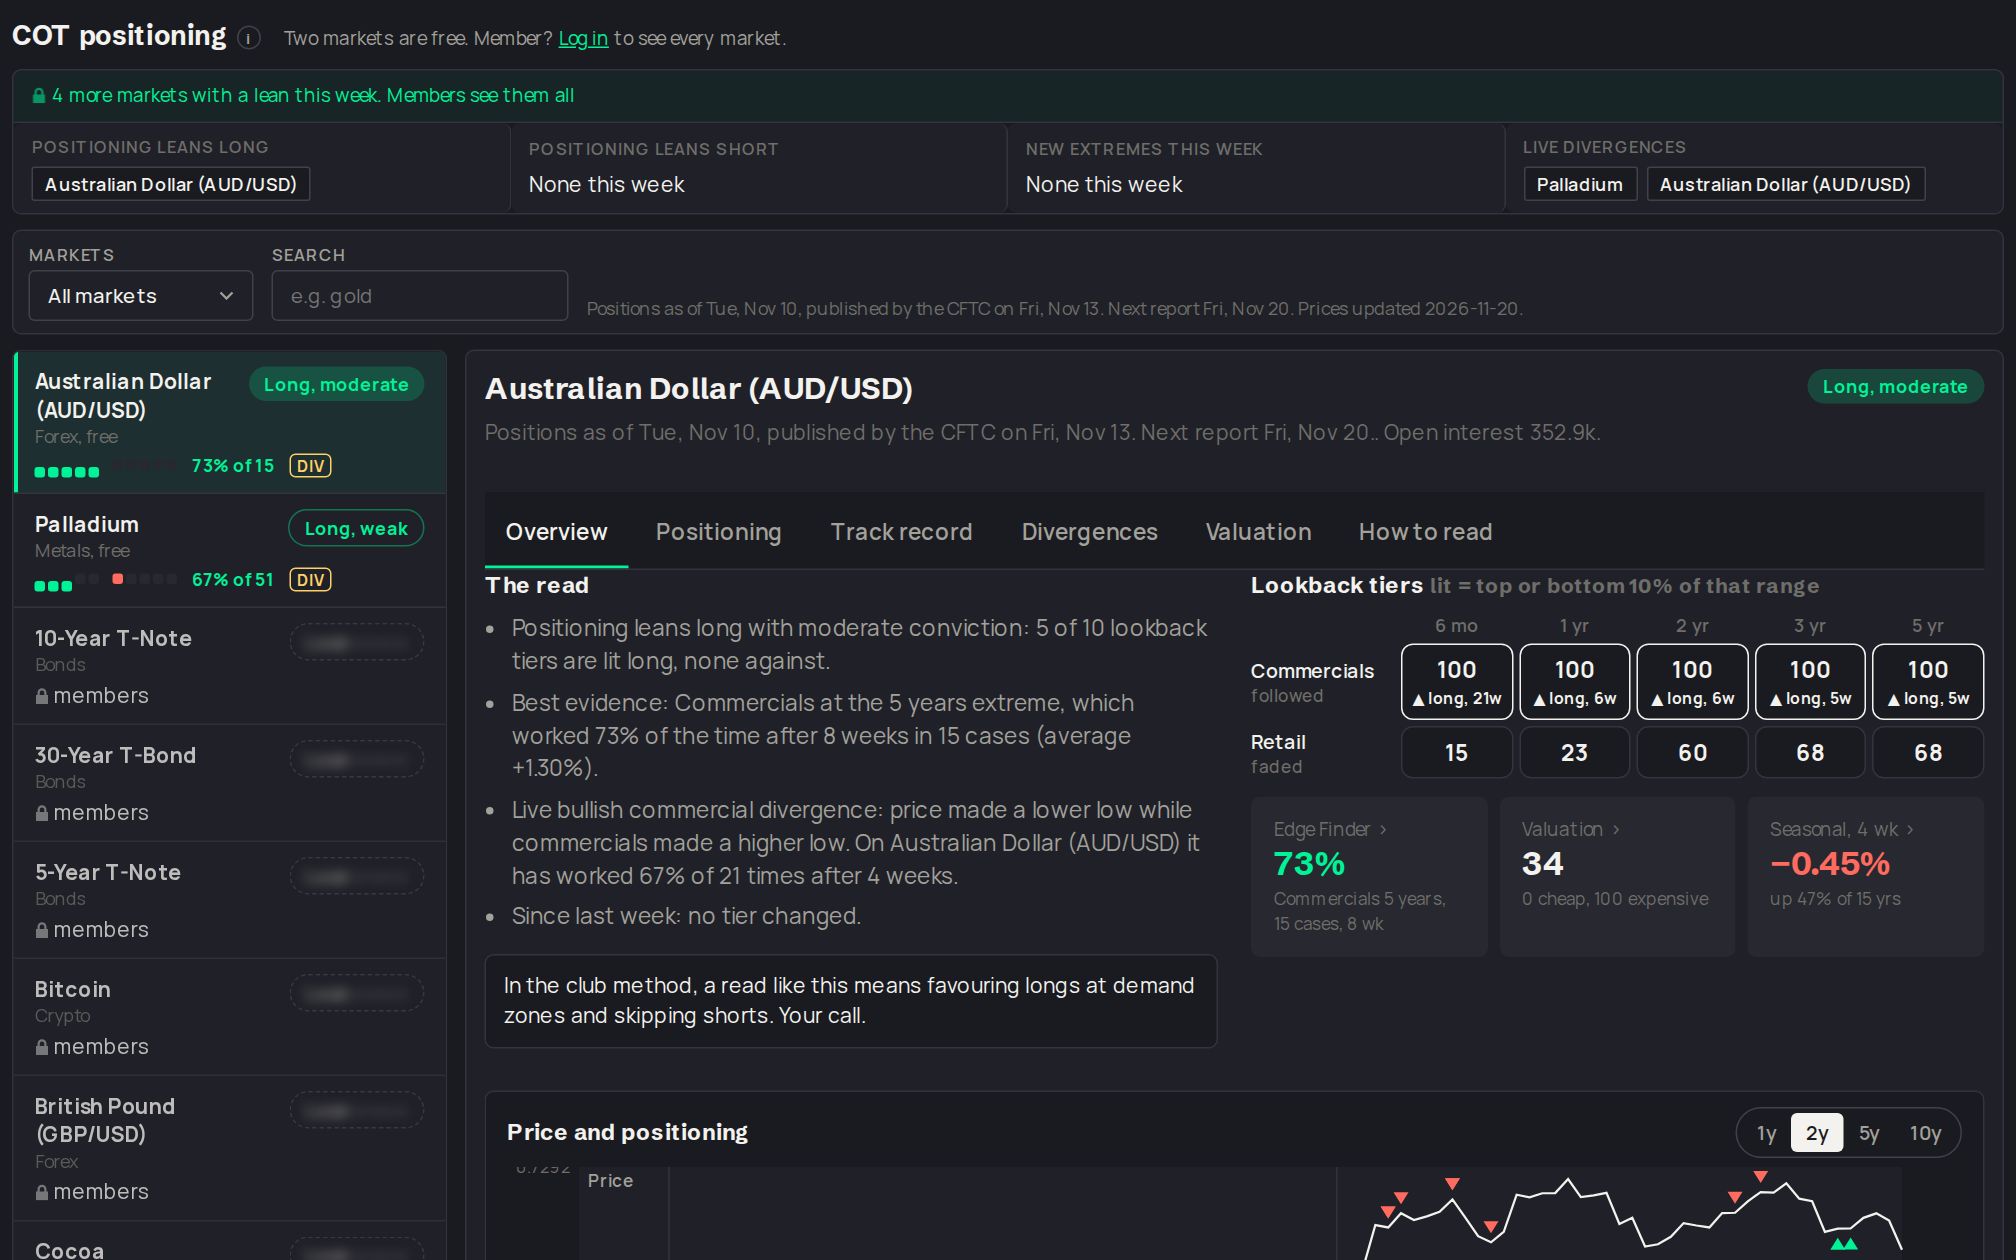
The COT index
The CFTC publishes positions every Friday for data taken on Tuesday. Commercials are the producers and users of a commodity, or the banks and companies hedging a currency. The COT index takes their net position (longs minus shorts) and scales it between its highest and lowest value over a lookback:
COT index = 100 × (net − lowest net) ÷ (highest net − lowest net)
Common lookbacks are 26 weeks for a shorter view and about 3 years for a longer one. Readings near the top of the range (often 75 to 80 and above) mean commercials are as net long as they have been in that window; readings near the bottom (25 to 20 and below) mean they are as net short as they have been. It is a weekly tool for direction, not an entry signal.
Why commercials and not speculators?
Commercials hedge, so they tend to buy weakness and sell strength. When they are unusually long while price has been falling, the market is often near a level where real buyers step in. Large speculators usually sit on the other side. Extremes can last for weeks, which is why the index sets the bias and the chart decides the timing.
Open the COT dashboardPositioning for 50+ markets on five lookbacks, with the track record of every extreme.The valuation indicator
Valuation asks whether a market has moved a lot relative to a benchmark, usually the US dollar index, gold and Treasury bonds. Price is compared to each benchmark over a short lookback and scaled, so readings at an extreme suggest the market is overvalued or undervalued against money, metal and rates. Like the COT index, it sets context, not entries.
Putting them together
A strong bias is when the COT index, valuation and seasonality agree. Our COT dashboard shows the index on 13-week to 3-year lookbacks for every market, with each extreme's past track record, and the dashboard puts COT, valuation and seasonality side by side. For a full walk-through of the method, read the two-step strategy.
The Underdog Trade Club is an independent community and is not affiliated with Bernd Skorupinski, Larry Williams, Seasonax or their official brands.
Questions
What lookback does the Larry Williams COT index use?
Traders commonly use 26 weeks for a shorter view and about three years for the longer view. Comparing both helps: an extreme on both is stronger than an extreme on one.
What COT index reading is bullish?
Readings near the top of the range, often 75 to 80 and above, mean commercials are unusually net long, which traders read as a bullish bias. Near the bottom is a bearish bias.
Can I trade the COT index on its own?
It is a weekly bias tool, not a timing tool. Extremes can last for weeks. Use it with valuation and seasonality, and time entries on the chart.
Is the COT report delayed?
Yes. Positions are as of Tuesday and published on Friday afternoon US time, so the data is three days old when you see it. That is fine for a weekly bias.