Free seasonal charts for 50+ markets
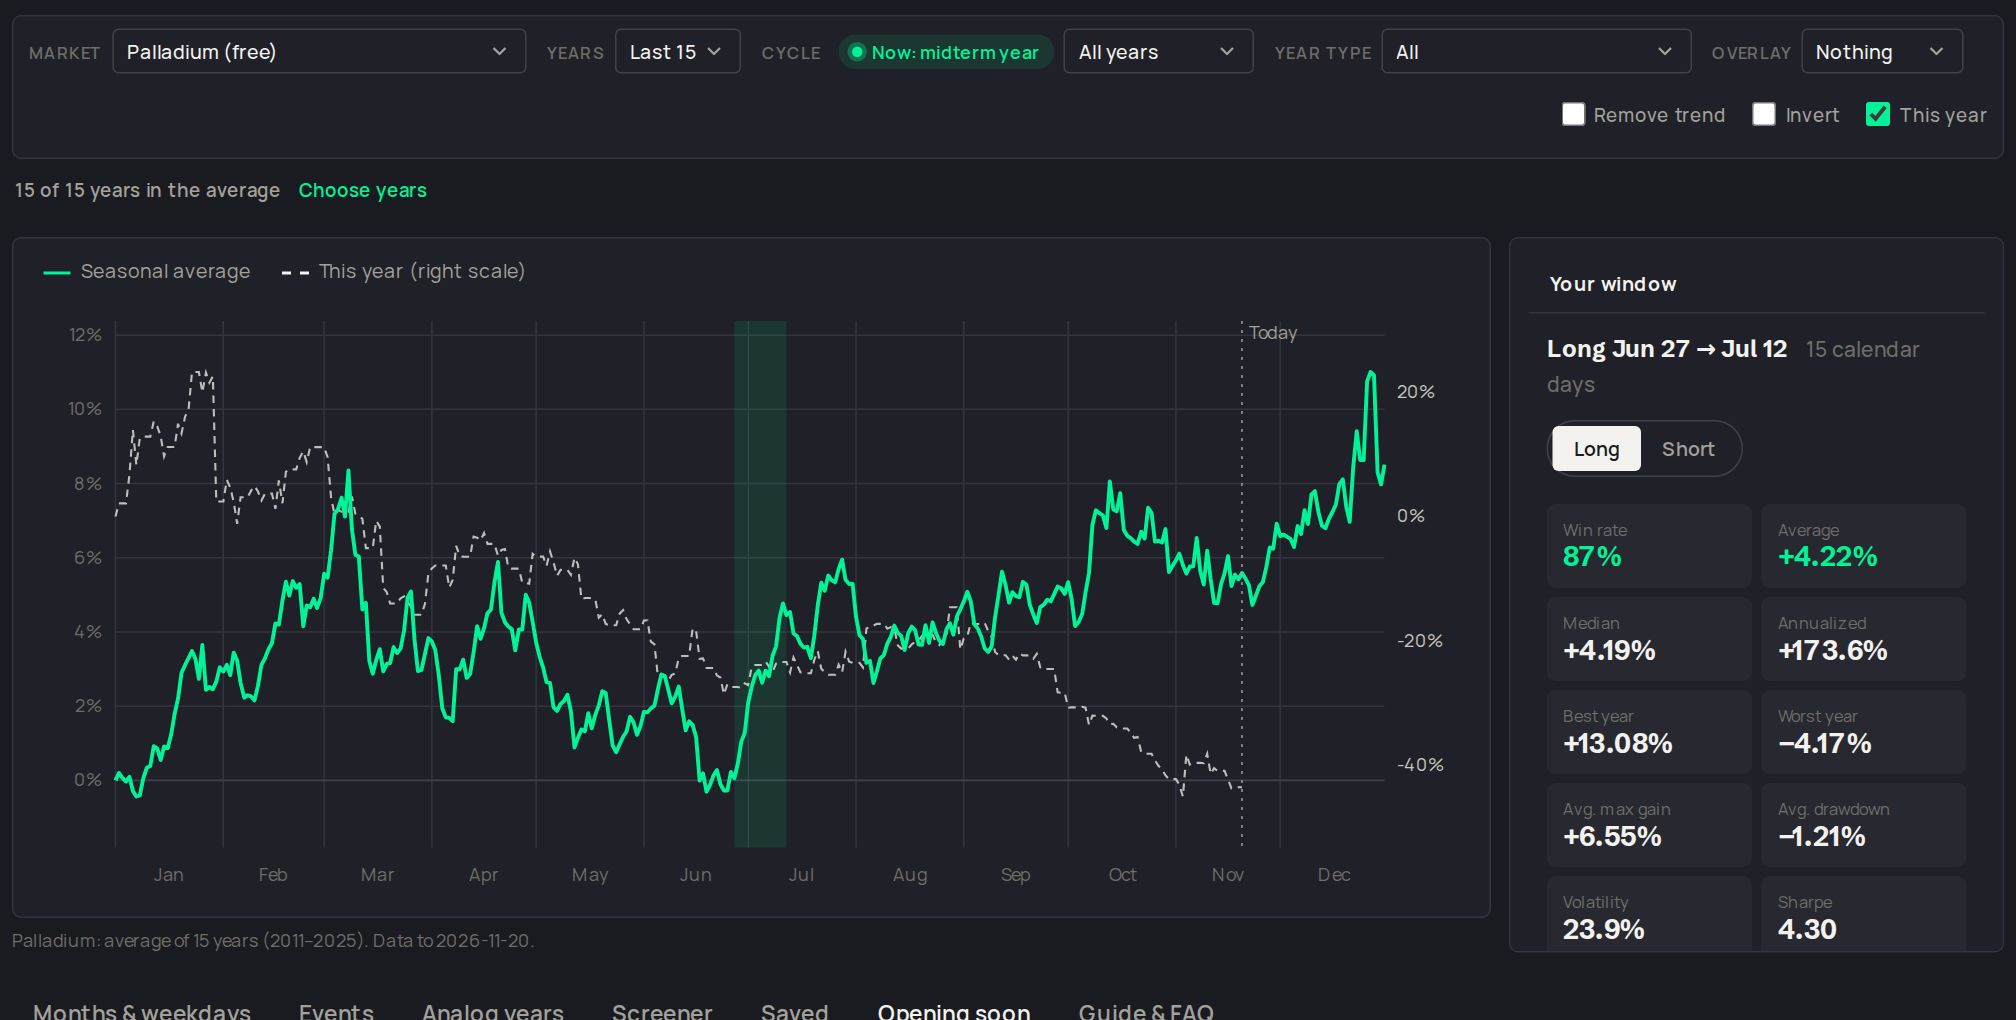
A seasonal chart shows how a market has moved on average through the calendar year. Averaged over 10 to 30 years, it reveals tendencies with real causes: harvests in grains, heating and driving demand in energy, year-end flows in currencies, and the tax and fund calendar in indices.
Markets covered
Forex: EUR/USD, GBP/USD, USD/JPY, AUD/USD, NZD/USD, USD/CAD, USD/CHF and the main crosses, plus the dollar index. Metals: gold, silver, copper, platinum, palladium. Energy: WTI and Brent crude, natural gas, heating oil, gasoline. Indices: S&P 500, Nasdaq 100, Dow, Russell 2000 and Nikkei futures. Grains and softs: corn, wheat, soybeans, meal, oil, oats, coffee, cocoa, sugar, cotton, orange juice. Meats: live and feeder cattle, lean hogs. Rates: 5-, 10- and 30-year Treasuries. Crypto: Bitcoin and Ethereum.
How to read a seasonal chart
- Look for slopes, not single days: a steady rise over several weeks is more useful than one spike.
- Check the win rate and worst year for the window, not just the average. One huge year can carry an average.
- Compare lookbacks: a pattern that shows on 10, 15 and 30 years is sturdier than one that only shows on 5.
- Filter by the presidential cycle for indices and the dollar: midterm years behave differently from election years.
Use it with the rest of the evidence
Seasonality is strongest when COT positioning and valuation point the same way. Open the seasonality explorer to test any window, or the dashboard to see all three for every market at once.
The Underdog Trade Club is an independent community and is not affiliated with Bernd Skorupinski, Larry Williams, Seasonax or their official brands.
Questions
Where can I find free seasonal charts?
The Underdog Trade Club's seasonality explorer is free for core markets like crude oil, the euro and Bitcoin; members get all 50+ markets.
How many years should a seasonal chart use?
15 years is a good default. Check 10 and 30 too: patterns that hold across lookbacks are more reliable.
Do seasonal patterns work in forex?
Some do, often around year-end and quarter-end flows, but they are weaker than in commodities. Treat them as a tailwind and confirm with positioning.
What is the presidential cycle?
The four-year US election cycle. Stock indices and the dollar have tended to behave differently in election, post-election, midterm and pre-election years.